Taxonomy projects often combine open and closed card sorting, online and offline techniques plus stakeholder workshops to gather information and disseminate findings.
Listed below are the methodologies that support IA & Taxonomy Creation.
Card Sorting
Open Card Sorting
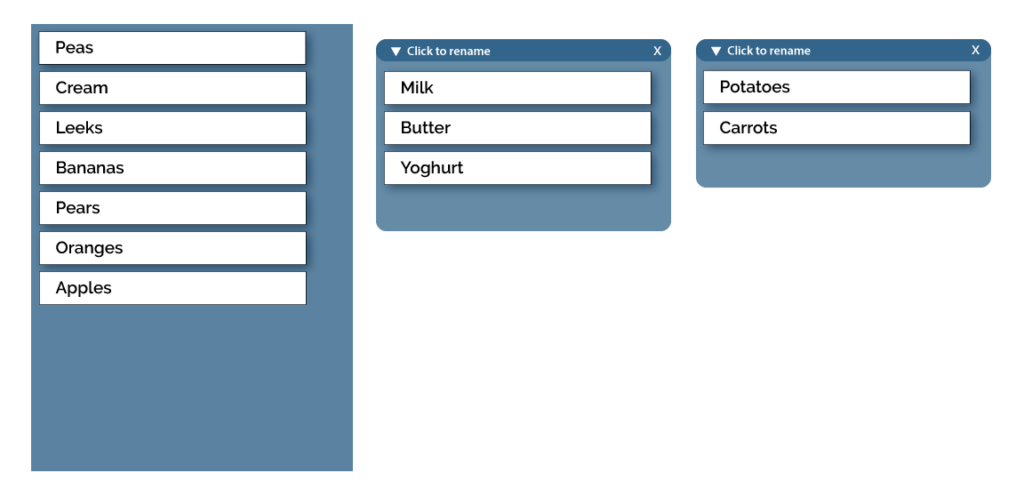
In Open Card Sorting, we give the participants the cards and they sort the cards and define the name of groups. An example of this is shown below;
As the illustration shows the user is given various food products such as apples and Cream and asked to group them. The user in the example has decided to group dairy items together and vegetables together. They have the ability to not only group the items like this but to name those groups.
Closed Card Sorting
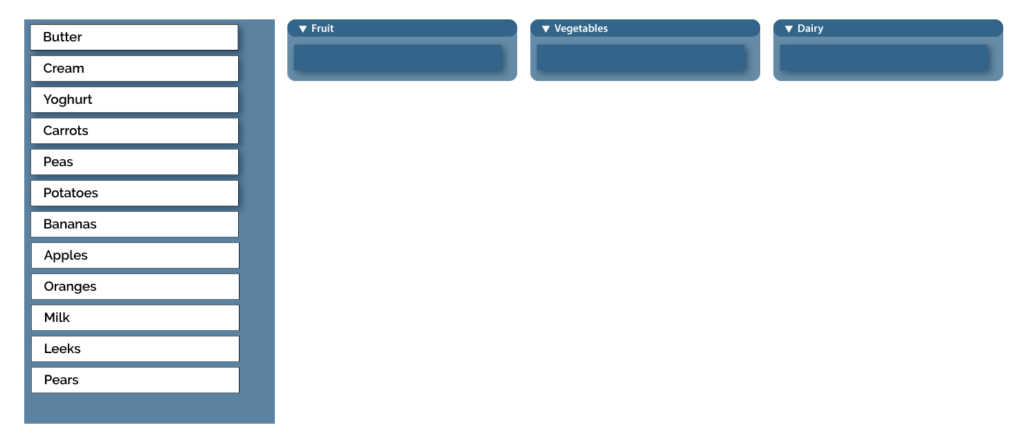
Closed card sorting is similar but in this case we give the participants the content group names and ask them to organise the items into those predefined groups. This is illustrated as follows:
In this case the example shows that the user has been given the groups of ‘Fruit’, ‘Vegetables’ and ‘Dairy’ and is being asked to group the items within these categories.
In our experience, it is better to run open card sorting on a wider scale and scope in order to include the majority of content items and rigorously test the grouping and naming.
Open card sorting tends to be used first to determine the overall hierarchy, groupings and category names.
Closed card sorting can then be used to categorise the remaining content items that may not have been included in the first stage.
Qualitative Card Sort
Qualitative research used to carry out card sorting and tree testing utlises a small number of participants in one-to-one sessions lasting about 60 minutes. It tends to be used when we wish to understand why a user has grouped and named content in the way they have.
Carrying out the Research
With qualitative card sorting, we create physical cards for the user to group and organiseduring the session. There will be a maximum of 50 items and the user is given plenty of time, up to an hour, to group items and name the groups.
This will all be done under the watchful eye of a user experience consultant. They will encourage the participant to explain what they are doing, why they are grouping items as they are and where the rationale for the name they have decided for a group has come from. This is known as “think aloud protocol” and is common in UX research techniques.
We typically run 8 to 10 one to one qualitative card sort sessions in order to gather sufficient data for analysis and to provide a recommended hierarchy.
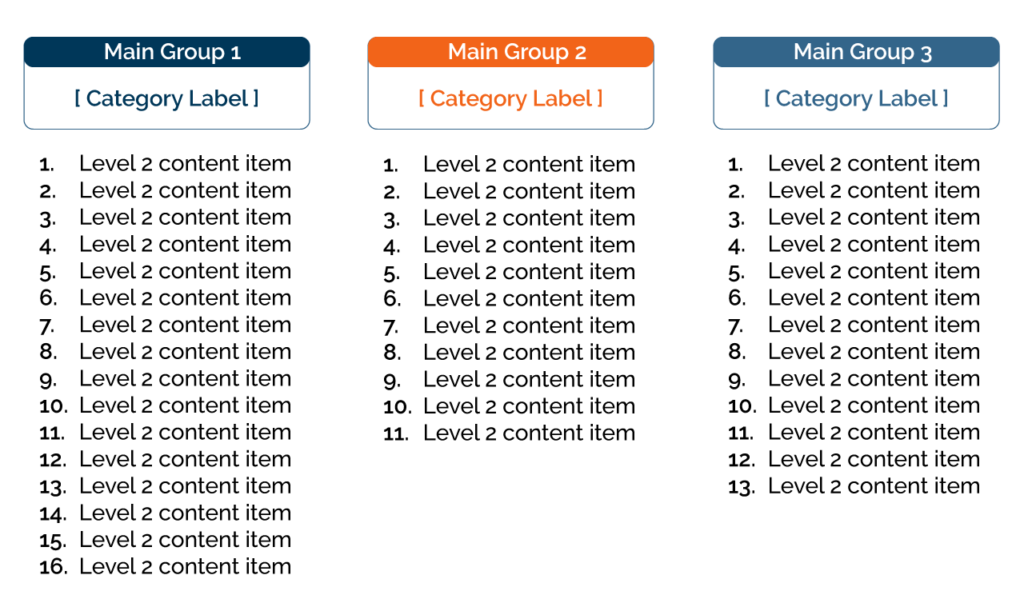
The hierarchy will typically show the main content groupings and the next level items that sit below them. It could look something like this:
It is possible that more than one solution to the navigation is generated from the research and if this is the case we will provide both versions together with recommendations for which to use.
Quantitative Card Sort
Quantitative card sorting and tree testing utlises a large number of respondents recruited from a panel. They are invited to participate in an online card sort exercise created in specialist software such as Optimal Sort. The large number or responses offers a high degree of confidence in the findings.
Quantitative card sort is very similar to qualitative card sort but instead of creating physical cards the content items are provided to the user via online software. As a result, we cannot learn why a user may have grouped and named content as they have. Instead we are relying on a large number of responses to derive confidence in the findings.
Carrying out the Research
We typically run the online card sort with 500 respondents recruited from a panel – Optimal Sort has an integrated panel which ensures this step is technically simple. A sample of 500 will provide a very robust data set from which we can carry out our analysis. However, we can run the online card sort with a smaller panel if budget constraints require us to do so.
Some customers run their own customer panel and ask us to utilise this for quantitative card sort research. This can represent a large cost saving to the project and we are happy to do it. The card sort software we use simply produces a link that can be emailed to the panel and responses are captured in the usual way.
The key consideration with the panel is the speed of collection and achieving the quota. In most of the projects we have run using an integrated panel we have been able to meet a quota of 500 completes within 5 to 10 days of launching the study.
OPTIMAL SORT:
The software we use for online card sorting projects is Optimal Sort.
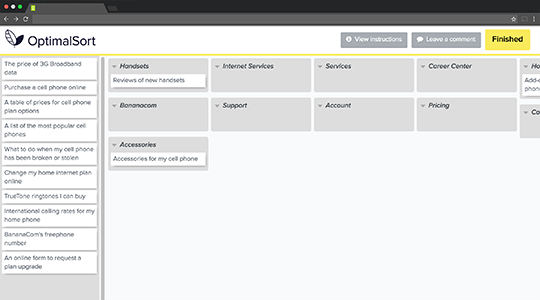
Respondents are asked to organise and group a sub-set of circa 50 items that they can drag and drop from a list on the left of their screen into groups on the right. They are then asked to name the groups and we can also allow them to rename the items if that methodology is agreed.
Here is a screen grab of what a user typically sees in Optimal sort:
Analysing the Findings
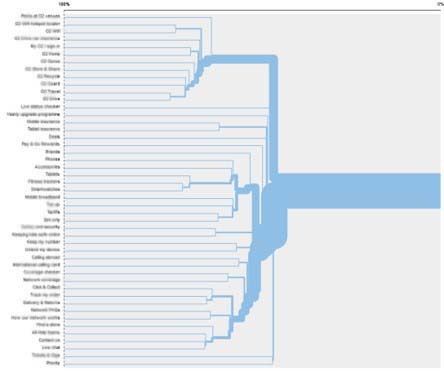
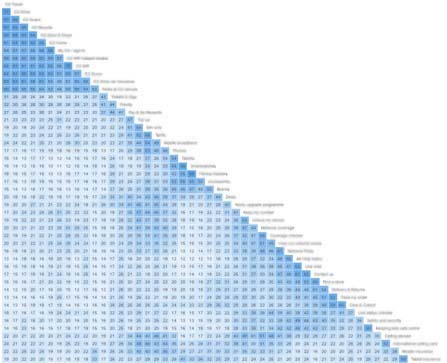
With the data captured from the online card sort we will complete analysis of the findings. This will include the creation of dendrograms and similarity matrices as appropriate and illustrated as follows:
The analysis will allow us to identify associations between groups.
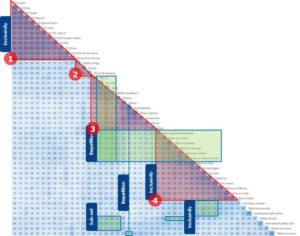
Guiding REISS principles (Repetition, Exclusivity, Inclusivity, Sub-Setting, & Similarity) when applied help evolve grouping that creates a number of main groups. Opportunities to cross reference/merge items will be indicated by pairing relationships (in the example, these are highlighted with green blocks).
The best merge method will be used to identify groupings.
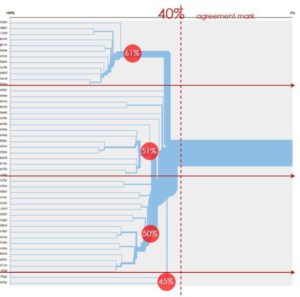
The illustration below shows percentage of participants that agree in full or partially with four larger groups based on their individual pairing. Participants have all grouped at least two of these cards together in each large group. All participants agree with parts of the four larger groups, with 50% or more individual pairings matched.
Delivering the Findings
The outcome from the online card sort analysis will be one or more suggested grouping models. These will form the basis of a customer centric taxonomy and are often tested by running qualitative card sorting as a second stage. In the qualitative sessions we are able to interrogate why users may have grouped and named content in certain ways during the quantitative research. This dual method provides good checks and balances to ensure the final outcome is a robust taxonomy.
Tree testing
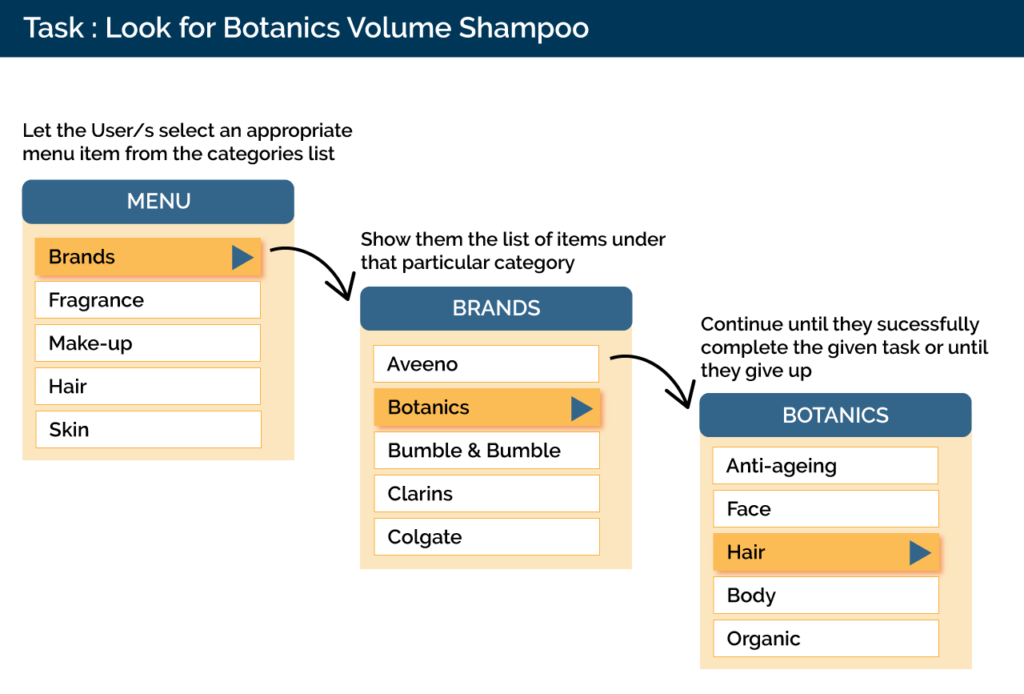
Rather than utilising cards, respondents are given various browse tasks similar to those they would use in the real world. They are asked to interact with the navigation (Information Architecture) only and there are no visual design or navigation aids – a low-fidelity prototype. The respondent clicks the labels within the navigation in order to complete the task.
The following graphic illustrates the process.
By isolating the IA we are able to rigorously evaluate its effectiveness including the structure, naming and grouping of items within the navigation and structure.
CASE STUDY:
A large UK company approached us to review the taxonomy of a live website that had undergone some redesign but not had any changes make to the navigation and hierarchy. The new design utilised the original hierarchy which had grown over the years with new items added through unplanned changes. We ran a series of online and offline card sorting exercises, stakeholder workshops and delivery sessions as we helped them create a new customer centric navigation container.
Have a Project in Mind?


